Korea's 2026 market crash, explained: what broke, what it cost, and where the KOSPI stands now
The KOSPI roughly doubled, then fell 44% from its all-time high of 9,385.59 on 19 June. Here is what actually caused it — leveraged single-stock ETFs, margin debt and a two-stock index — and where the market stands in August 2026.
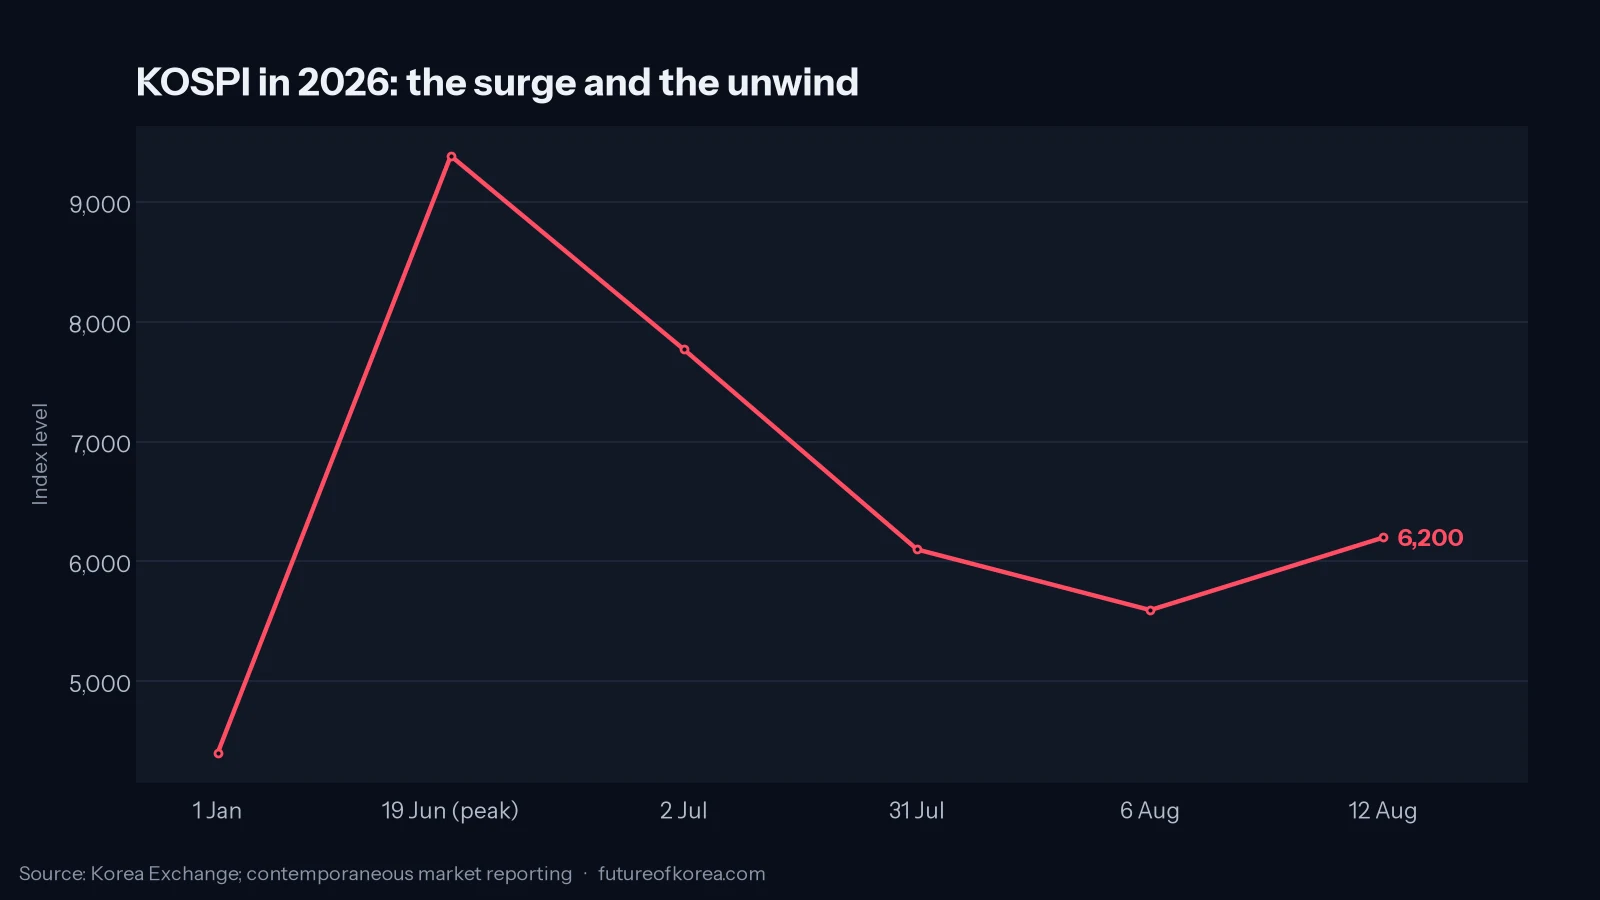
For most of the first half of 2026, the Korean stock market was the best story in global equities. Then, over about five weeks, it became a cautionary one.
Both things were caused by the same feature of the market, and if you only read the headlines from either phase you will draw the wrong conclusion about what Korea is. This piece is an attempt to describe the mechanism plainly — what rose, why, what broke, and what the market actually looks like as of 12 August 2026.
The scale of the move, in two numbers
The KOSPI roughly doubled in the first six months of 2026, peaking at an all-time high of 9,385.59 on 19 June. That is not a normal year; that is not even a normal bull market year. It is one of the largest half-year gains any major national index has produced in the modern era, and it happened in a market that had spent the preceding decade as a byword for a valuation discount.
Then, from that 19 June peak into early August, the index gave back about 44%. Estimates of the market value destroyed cluster above $2tn — a drawdown deeper, in percentage terms, than either the 1997 Asian financial crisis or the 2008 global financial crisis.
Who was actually buying
The single most important fact about the 2026 rally is that foreigners did not drive it. They sold into it, heavily.
| Investor type | Net flow, H1 2026 (KOSPI) |
|---|---|
| Foreign investors | −₩148.3tn (≈ −$96.7bn) — a record net sale |
| Domestic retail investors | +₩64.6tn to +₩97tn, depending on the measure |
Foreign selling of that magnitude alongside a doubling index is genuinely unusual, and the explanation is largely mechanical rather than bearish. Three things were happening at once:
- Profit-taking on the memory names. Foreign institutions had been overweight Samsung Electronics and SK hynix through the AI memory cycle. When those positions ran, they trimmed.
- Benchmark-weight compression. As Korean stocks surged, Korea’s weight inside global and emerging-market indices rose sharply. Active managers with position limits and tracking-error budgets were forced to sell simply to stay inside their mandates. This is the least intuitive driver and probably the largest.
- The won. A weakening currency erodes dollar-denominated returns even when local prices rise, which pushed some unhedged foreign holders towards the exit.
Meanwhile domestic retail absorbed most of it — net buying figures for the half range from ₩64.6tn to ₩97tn depending on whether you count direct equity purchases alone or include ETF flows. That is the setup that matters, because the marginal buyer determines what happens on the way down.
What actually broke: the leverage stack
The rally’s ending was not caused by a bad earnings print or a policy shock. It was caused by the structure of who owned the market and how.
Single-stock leveraged ETFs. In early 2026, Korean regulators approved leveraged ETFs tracking individual companies. These funds use derivatives to deliver a multiple of one stock’s daily move — and they rebalance daily to maintain that exposure, which means they must buy more as the stock rises and sell as it falls. That is fine when a market drifts. It is combustible when the underlying is a mega-cap with a 400%-plus annual move and the fund holders are individuals.
Margin debt. Retail buying was substantially financed. When prices turned, brokerages issued margin calls; unmet calls triggered automatic liquidation; liquidation pushed prices lower; lower prices triggered the next tranche of calls. Margin debt peaked at a record ₩38.63tn on 24 June; total forced liquidations then reached roughly ₩2.3tn in about two and a half months, with around 1.2 million retail accounts hit by margin calls.
Index concentration. Samsung Electronics and SK hynix together account for a very large share of KOSPI capitalisation, and they drove most of the index’s 2026 gain. An index that concentrated does not behave like a diversified market — it behaves like a leveraged bet on one industry’s capex cycle. On the way up that looked like genius. On the way down it removed any cushion.
Put the three together and you get the outcome: a 10.84% single-day fall, followed the next session by a record 17.91% surge on 31 July. Across 2026 the Korea Exchange has triggered seven market-wide circuit breakers and 36 trading halts — already more than half of all such events since the mechanism was introduced in 2000, with three market-wide halts inside about three weeks in July alone.
Where the market stands in August 2026
Where the floor actually sits is genuinely contested. Some accounts put it around the 6,200 level in the first week of August; others record a close of 5,593.56 as the rebound faded. Both are defensible depending on the session measured, and the honest description is a volatile 5,600–6,200 band rather than a settled bottom. Sell-side range forecasts cluster at 6,000–7,000, with foreign flows, the semiconductor cycle and CPI treated as the swing factors.
The honest summary is that published range forecasts cluster around 6,000–7,000, but individual twelve-month targets vary far more widely than that. A spread that broad is not a forecast; it is an admission that nobody knows which regime the market is in.
What this does and doesn’t tell you about Korea
It does not tell you the AI memory cycle was imaginary. Korea genuinely supplies a large share of the world’s high-bandwidth memory, and that demand is being driven by capital expenditure decisions taken far outside Korea.
It does tell you three things worth carrying forward:
- The KOSPI is a sector bet wearing an index costume. If you buy the benchmark, you are overwhelmingly buying memory semiconductors. Size the position as you would a sector fund, not a country allocation.
- Market-structure reform cuts both ways. Korea has spent years liberalising to attract capital. Leveraged single-stock products arrived as part of that modernisation and materially worsened the drawdown. Both facts belong in the same sentence.
- Retail depth is now a first-order variable. A domestic investor base large enough to absorb ₩148tn of foreign selling is a genuine structural change in this market. It cut the fall’s floor higher than it would have been in 2008 — and it also supplied the leverage that made the fall so fast.
What we’re watching next
The September launch of Korea’s revamped FX trading infrastructure is the next structural event, and it matters more for foreign flows than any single earnings print — a friendlier won market removes one of the three reasons foreigners sold in the first half. We’ll cover it when it lands.
Figures in this article are current as of 12 August 2026 and are sourced to the outlets and data portals listed below. Where estimates differ between sources, we have given the range rather than picking one.
Useful links & tools
Official portals and primary data sources for this topic. Opens in a new tab.
- Korea Exchange (KRX) — market data portal — Daily index levels, and the investor-type net buy/sell data behind the retail-versus-foreign story. English interface available.
- DART — Financial Supervisory Service electronic disclosure — Company filings for Samsung Electronics, SK hynix and every other listed issuer.
- Financial Services Commission — press releases — Where policy responses are actually announced, rather than reported second-hand.
- Bank of Korea — Economic Statistics System (ECOS) — Policy rate, USD/KRW and the capital-flow series that sit underneath the equity story.
- Trading Economics — South Korea stock market — Convenient historical index series for checking a headline number quickly.
Frequently asked questions
How far did the KOSPI actually fall?
Estimates vary with the measurement window. From the late-June 2026 intraday peak to the early-August trough, the decline was about 44%, wiping out more than $2tn of market value by most estimates. Measured from the peak to mid-August levels, the drawdown is smaller — around a quarter — because the index recovered part of the fall in the first fortnight of August. Always check which two dates a headline number is comparing.
Is the KOSPI still up for the year?
Yes, substantially. A doubling in the first half followed by a ~44% drawdown still leaves the index above where it started 2026. That arithmetic surprises people: a 44% fall only erases a 79% gain. Anyone who bought before March is very likely still ahead; anyone who bought in June on margin may not be.
What are single-stock leveraged ETFs and why did they matter so much?
They are exchange-traded funds that use derivatives to deliver a multiple — typically 2x — of one company’s daily return. Korean regulators approved them in early 2026. Because they rebalance daily, they mechanically buy into strength and sell into weakness, which amplifies moves in both directions. When they are concentrated in two names that dominate the index, that amplification is transmitted straight to the benchmark.
Did the government intervene?
There was an emergency policy response as the selloff accelerated, alongside the exchange’s automatic circuit breakers and sidecars. Treat specific claims about intervention mechanics carefully and check the Financial Services Commission’s own releases — coverage of Korean policy responses is frequently a step ahead of what has actually been decided.
Does this change the case for Korean equities long term?
It changes the risk description, not the underlying industrial story. Korea still supplies a large share of the world’s high-bandwidth memory. What 2026 demonstrated is that the KOSPI is a concentrated, leverage-sensitive index that can move like a single-sector bet — which is a different thing from a diversified emerging-market allocation. Size positions accordingly, and read the disclaimer.
Where can I see the official numbers myself?
The Korea Exchange publishes daily index levels, investor-type net buying and margin balances. The Financial Supervisory Service’s DART system carries company disclosures. Both have English interfaces — links are in the Useful links section above.
Sources & further reading
Every figure in the key takeaways is numbered to the source it was read from. Sources marked primary are the statistics office, central bank, exchange, regulator or filing itself.
- 1Market data portal — index levels and investor-type net flowsprimary — Korea Exchange (KRX) · verified 2026-08-12
- 2Explaining South Korea's Stock Market Boom — Korea Economic Institute of America · verified 2026-08-12
- 3South Korea's stock market crash is now officially worse than 1997 and 2008 — Yahoo Finance, August 2026 · verified 2026-08-12
- 4Behind the 100% surge: 148 trillion won of foreign capital flees as retail leverages in — 36Kr, 2026 · verified 2026-08-12
- 5Bear market after the 'mad bull' rally: 2.3 trillion won forcibly liquidated — 36Kr, August 2026 · verified 2026-08-12
- 6KOSPI ends wild week at -1% after record crash and surge — Seoul Economic Daily, August 2026 · verified 2026-08-12
Read next
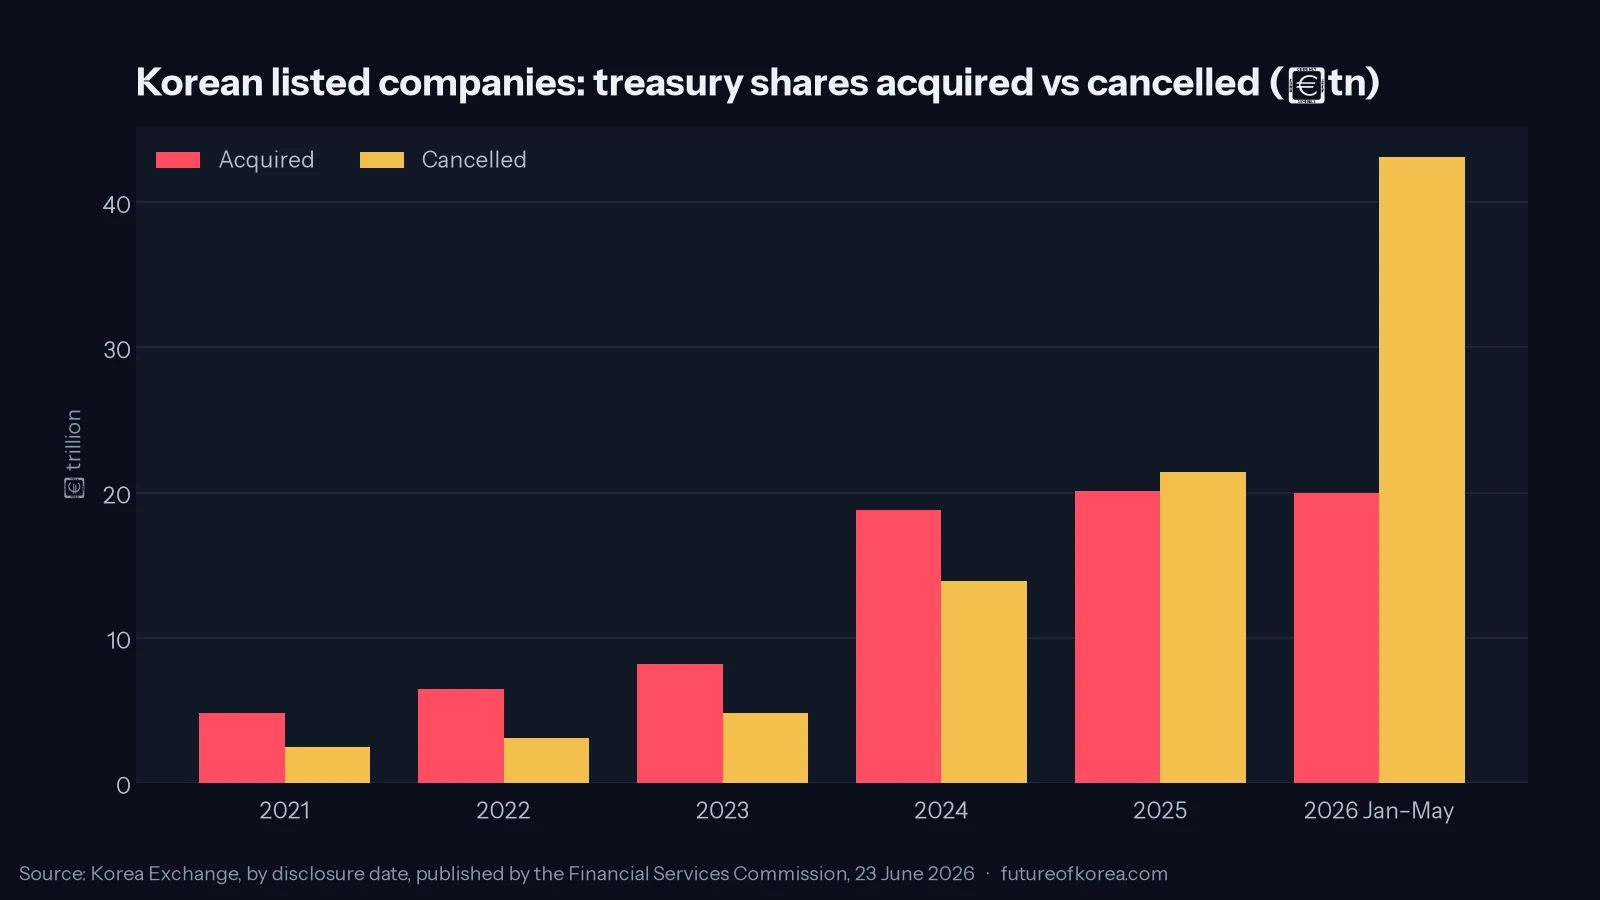
Korean companies cancelled ₩43.1tn of their own shares in five months — and bought only ₩20tn
A law that took effect on 6 March 2026 turned the treasury share from a control device into a countdown. Companies have until September 2027 to empty the vault, and the Korea Exchange numbers show them doing it faster than they are refilling it.
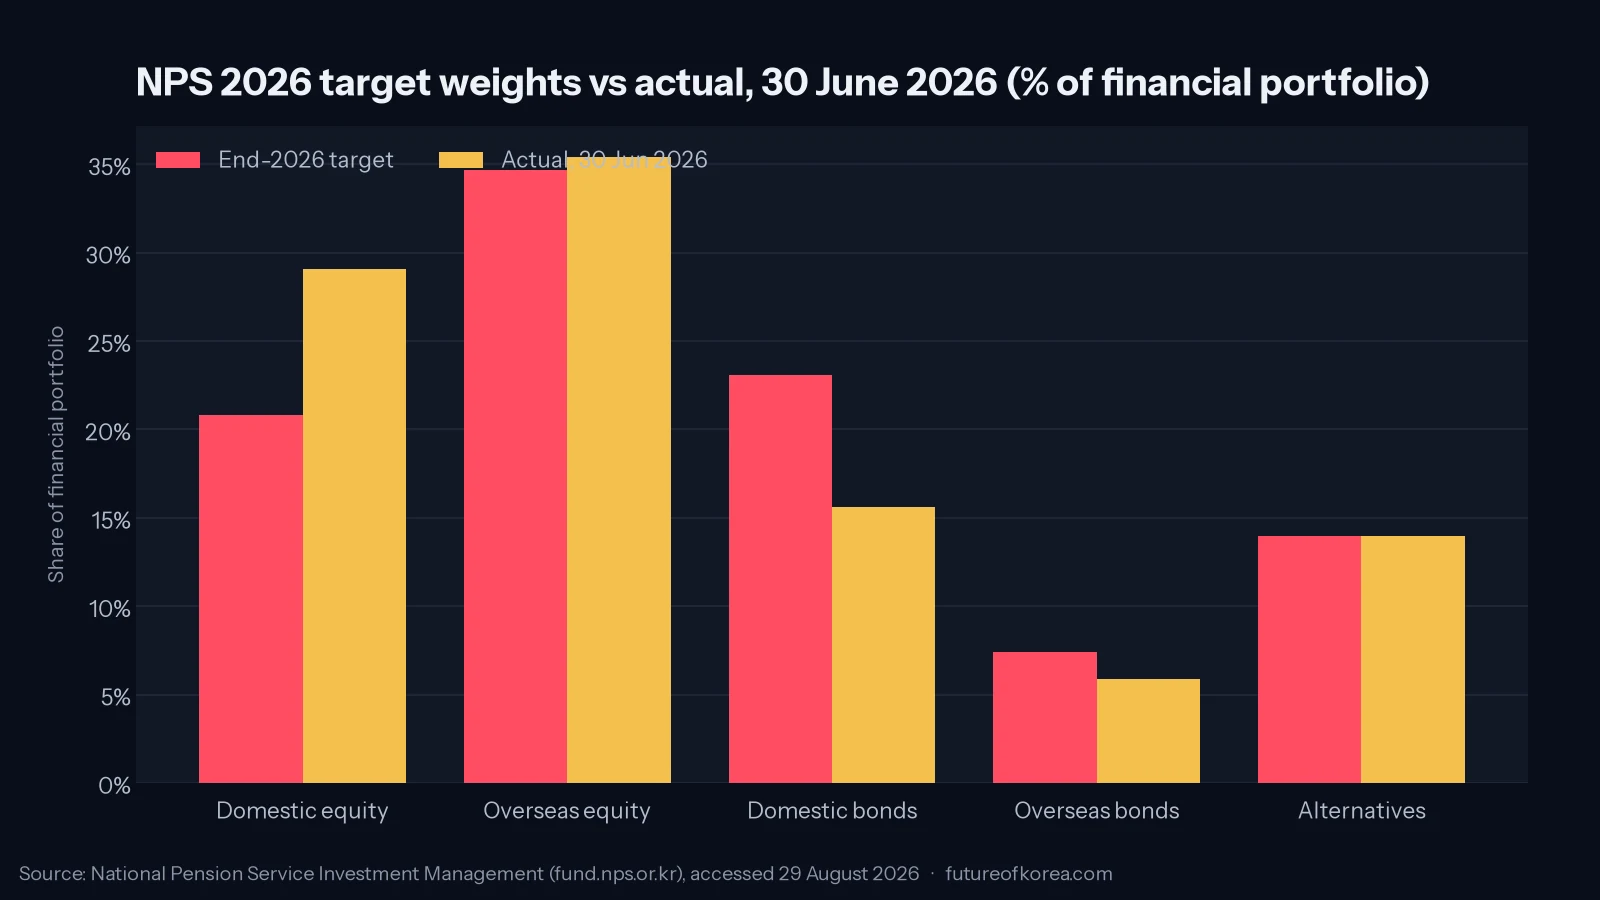
The National Pension Service raised its Korea target to 20.8%. It was already holding 29.1%.
On 28 May the National Pension Service raised its 2026 target weight in Korean shares from 14.9% to 20.8%. Five weeks later the fund held 29.1%. The gap, and what the fund is quietly underweight, matter more than the headline.
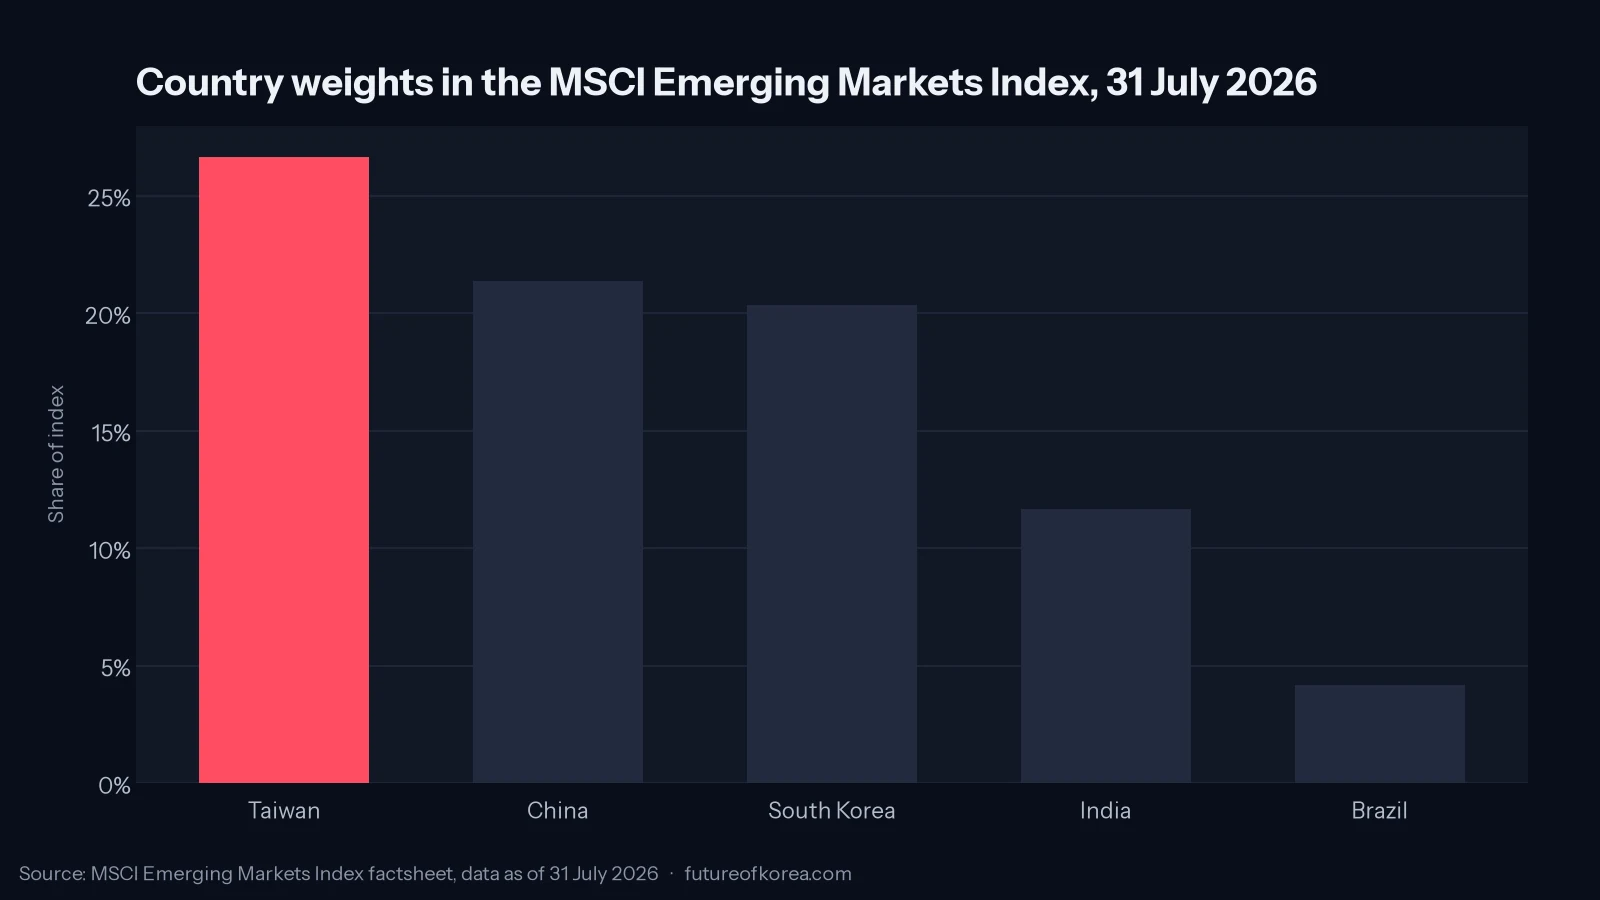
FTSE calls Korea a developed market. MSCI still calls it emerging.
Two index providers look at the same exchange and reach opposite conclusions. The disagreement is about the won, and the arithmetic of an upgrade is less flattering than the campaign for one suggests.