Chips are now 47% of Korea's exports. What happens when prices turn?
Semiconductors were 46.8% of everything South Korea shipped in the first ten days of August 2026. Strip chips out and the export boom is an ordinary year — which is precisely why the concentration matters.
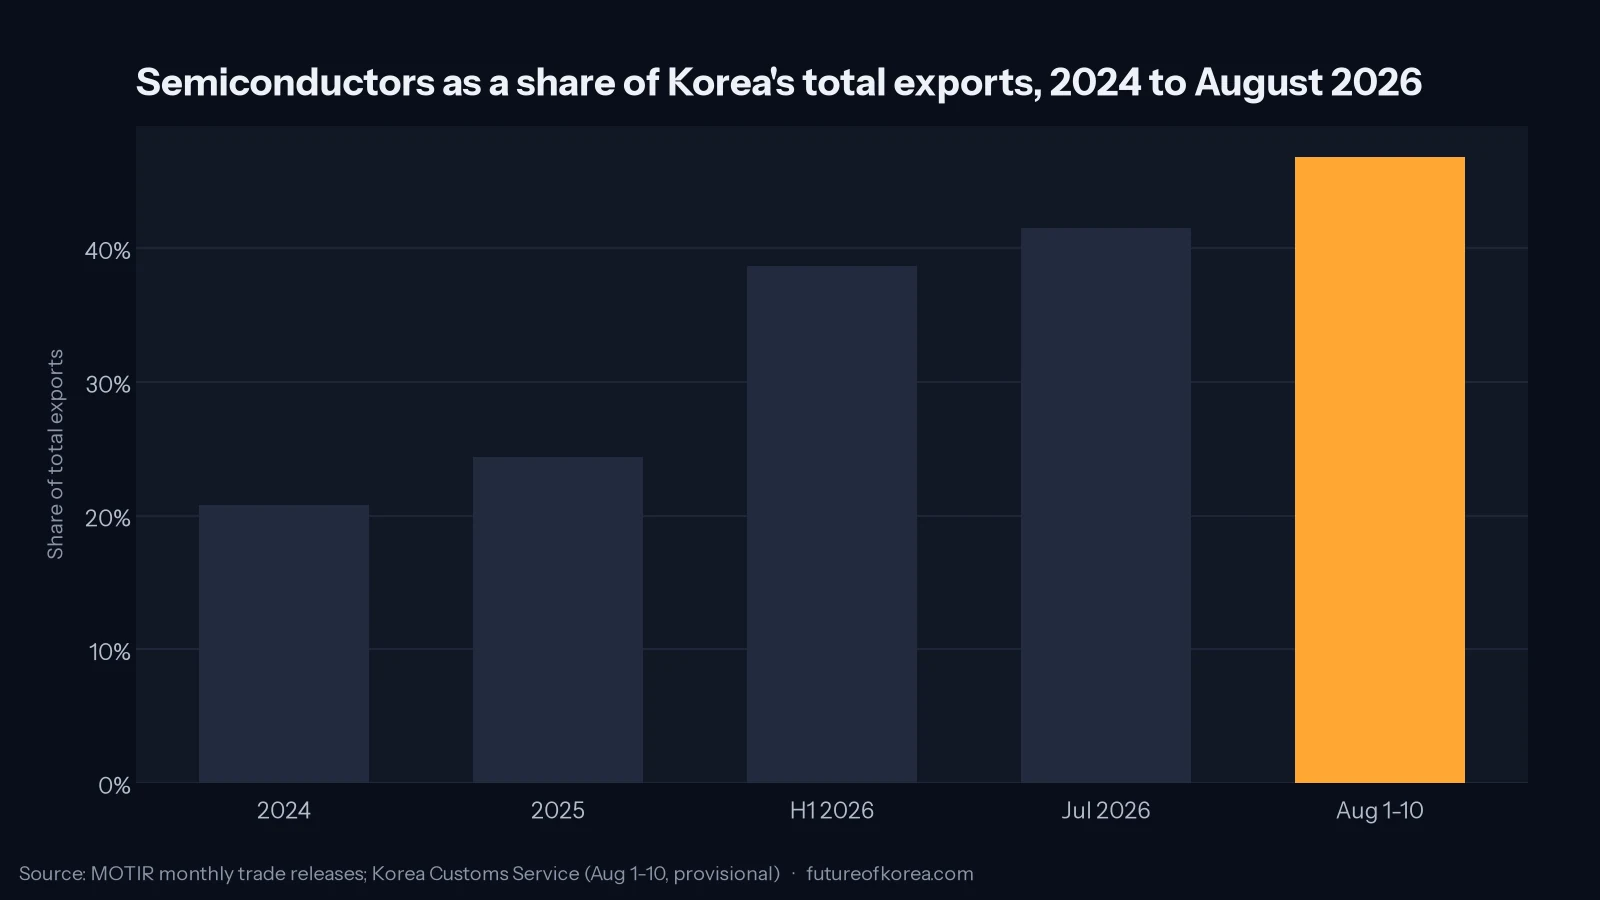
In the first ten days of August 2026, South Korea shipped $21.29 billion of goods. Semiconductors were $9.95 billion of that — 46.8% of everything the country sold abroad, according to Korea Customs Service provisional figures released on 11 August. A year earlier the same share was 26.7%.
That is the highest chip share ever recorded for a ten-day period, and it is the number the wire copy led with. The more useful question is what the other 53% has been doing, because the answer changes how you should read every Korean macro headline for the rest of the year.
The boom is one product line
Set the ten-day figure aside for a moment and look at complete periods, where the working-day noise washes out.
| Period | Total exports | Semiconductors | Chip share |
|---|---|---|---|
| 2024 (full year) | $683.8bn | $141.9bn | 20.8% |
| 2025 (full year) | $709.7bn | $173.4bn | 24.4% |
| H1 2026 | $496.7bn | $192.4bn | 38.7% |
| July 2026 | $98.89bn | $41.01bn | 41.5% |
| 1–10 Aug 2026 | $21.29bn | $9.95bn | 46.8% |
Shares calculated from the reported totals. Sources: MOTIR annual and monthly releases; Korea Customs Service for the August period.
Two things fall out of that table. First, the share has more than doubled in nineteen months — from roughly a fifth of exports to something approaching half. Second, semiconductor exports in the first half of 2026 alone, at $192.4 billion, already exceeded the previous full-year record of $173.4 billion set across all of 2025.
The other half of the picture is quieter than the headlines suggest. The Ministry of Trade, Industry and Resources reports that non-semiconductor exports rose 16% in the first half of 2026 and 26% in July. Those are good numbers. They are not extraordinary numbers, and they are the ones that describe the shipyards, the chemical plants, the steel mills and the car factories where most Korean manufacturing employment actually sits.
Most of the growth is a price, not a shipment
This is the part that consistently goes missing in coverage of Korean trade data, and it is not a matter of interpretation — the ministry says so in its own release.
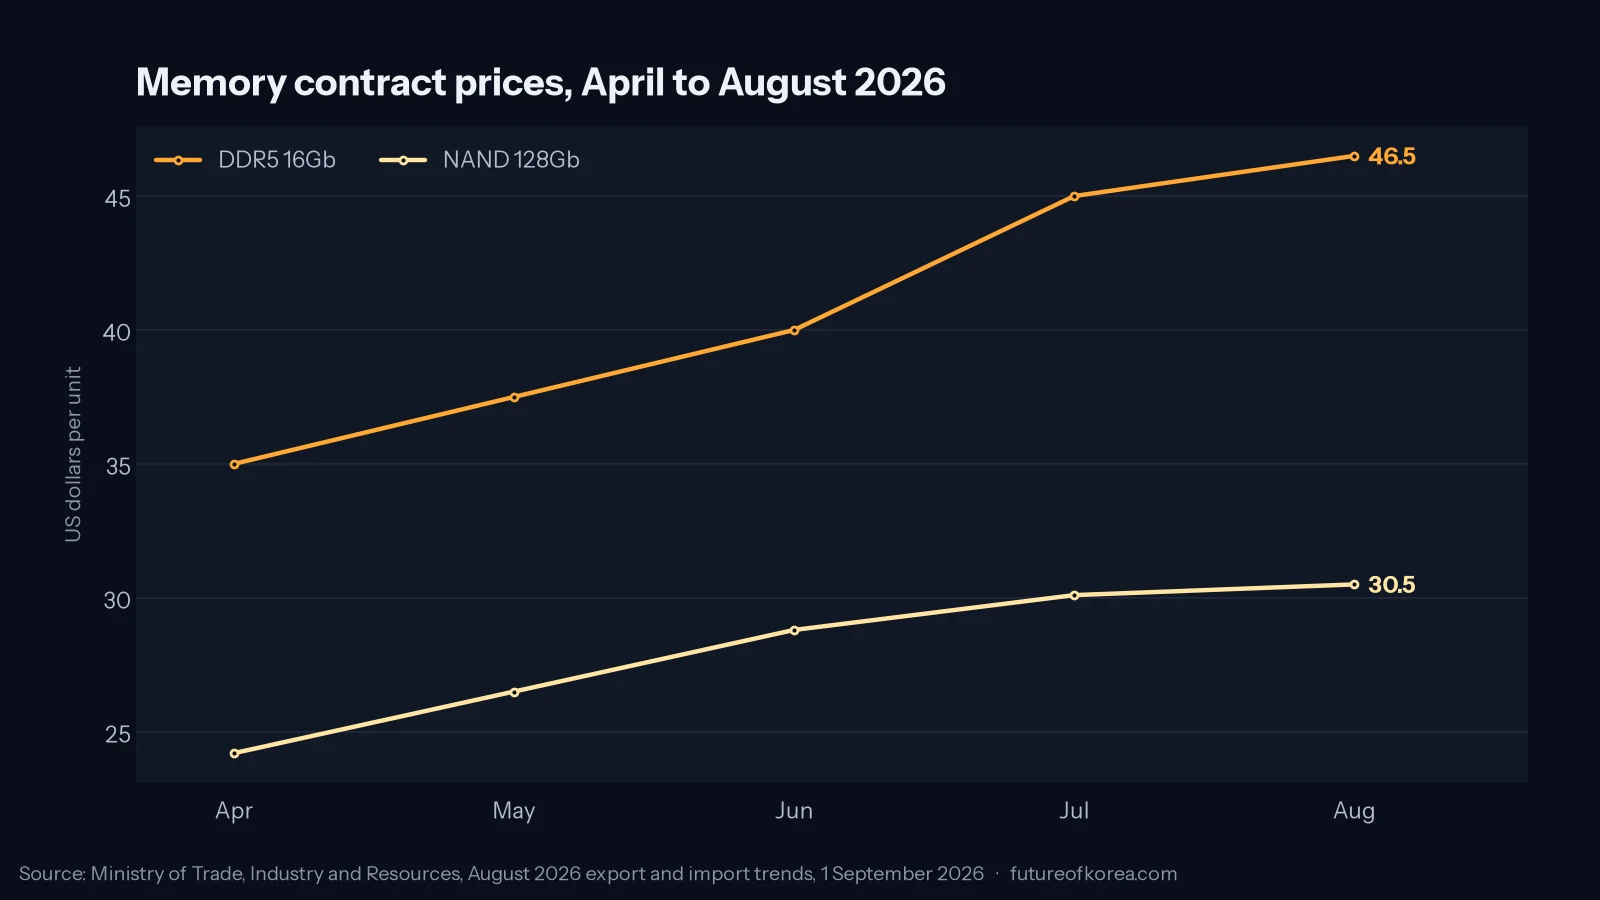
MOTIR attributes the semiconductor surge to AI server investment and “higher memory contract prices.” Contract prices are the fixed prices at which memory makers sell to large buyers, reset periodically. When they rise, the dollar value of an unchanged number of shipped chips rises with them.
The same release makes the value-versus-volume gap explicit elsewhere. In July 2026, petroleum product exports rose 34.1% by value while volumes fell 8.8%. Petrochemical exports rose 10.3% by value while volumes fell 9.1%. In both cases Korea shipped less and earned more, because prices moved.
Dollar export totals, in other words, are partly a price index. That is always true; it is unusually true in 2026, in the one category that now accounts for nearly half the total.
What a price reversal would actually cost
Nobody publishes a credible forecast of memory contract prices, and this piece will not invent one. But the exposure can be sized with arithmetic on published figures.
July 2026 exports were $98.89 billion, of which chips were $41.01 billion. Hold every other line steady and vary only the semiconductor line:
| Scenario for chip export values | Monthly exports | Change vs July 2026 |
|---|---|---|
| Unchanged | $98.9bn | — |
| Down 25% | $88.6bn | −10.4% |
| Down 50% | $78.4bn | −20.7% |
| Back to July 2025 level (~$14.7bn) | $72.6bn | −26.6% |
Author’s calculation holding non-semiconductor exports at their July 2026 level of $57.9bn. Illustrative, not a forecast. Base figures: MOTIR, July 2026.
Note what the last row implies. Even a full round-trip in chip export values — back to where they stood a year ago — would leave Korea’s monthly exports around $72.6 billion, which is above any month before 2026. The non-chip economy has genuinely grown. What would vanish is the growth rate, the trade surplus of the size Korea is currently running, and a large part of the earnings that have driven Samsung Electronics and SK hynix share prices. For who supplies what in that market, see our breakdown of who actually supplies the AI memory behind the 2026 boom.
The surplus is the line to watch. Korea’s cumulative trade surplus for January–July 2026 was $168.0 billion, against $33.9 billion in the same period of 2025 — an improvement of $134.1 billion. A country running that surplus has a great deal of policy room. A country whose surplus is one product line’s contract price has considerably less of it than the number suggests.
The destination map is re-concentrating
Between 2024 and 2025 Korea’s export mix diversified: ASEAN’s share rose from 16.7% to 17.3%, exports to Latin America and the CIS grew fastest, and reliance on both China and the United States fell. MOTIR made a point of this in its 2025 annual release.
Chips have partly reversed it. In July 2026 exports to China rose 96.2% to $21.68 billion and exports to the United States rose 68.7% to $17.43 billion — the two markets that buy the AI infrastructure the memory goes into. ASEAN, at $18.80 billion, set an all-time monthly record, but much of that is also semiconductors moving to assembly and test sites.
So the same force driving the export record is quietly rebuilding the concentration that Korean trade policy spent two years trying to reduce — and doing it at a moment when Minister JK Kim’s own July statement flags “new tariff measures under Section 301 of the U.S. Trade Act” as a live risk to the outlook.
How to read the ten-day numbers without being fooled
Korea Customs Service publishes provisional figures for the first ten and first twenty days of each month, and they are genuinely useful — nowhere else gets you trade data that fast. They are also extremely noisy, and the August release is a good illustration.
In the 1–10 August window, car exports fell 80.9% to $182 million. That is not a collapse in the Korean car industry; car exports rose 7.0% in July and shipments are lumpy, because a single vehicle carrier sailing on the 11th rather than the 9th moves the whole line. The same window showed exports to the United States down 0.2% while July’s monthly figure was up 68.7%.
Applied here: the 46.8% chip share is real, and it is the highest reading on record, but the defensible statement is that chips are running somewhere in the low-to-mid 40s as a share of Korean exports, and rising. July’s 41.5% is the more reliable anchor.
What this means for anyone with exposure to Korea
If you hold Korean equities, the index is now close to a leveraged position on memory contract prices. That is not a new observation about the KOSPI, but the export data shows how far the concentration has gone at the national-accounts level rather than just the index level — and Korean equities have already demonstrated in 2026 how quickly that can unwind, as our account of the 2026 KOSPI crash sets out.
If you are watching the won, the record surplus has not translated into currency strength, and the reasons are structural rather than cyclical; the mechanics are in our piece on why the won stays weak while exports boom.
If you work in Korea outside the chip supply chain, the macro headlines are describing a boom you are unlikely to feel directly. Non-semiconductor export growth of 16% in the first half is solid, ordinary performance, and the sectors carrying most employment — cars, machinery, petrochemicals, steel — grew in the low single digits or shrank.
The honest summary of Korea’s 2026 trade data is that it records two economies. One is having the best year in the country’s industrial history on the back of a global capital-spending cycle it does not control. The other is having a decent, unremarkable year. The published totals average them into a single triumphant number, and the gap between those two realities is the risk that Korean policymakers, and anyone with money in Korean assets, is actually carrying.
Figures current as of 14 August 2026. Export and trade totals are from Ministry of Trade, Industry and Resources monthly and annual releases; the 1–10 August period is Korea Customs Service provisional data and is subject to revision. Share calculations are the author’s arithmetic on those published totals.
Useful links & tools
Official portals and primary data sources for this topic. Opens in a new tab.
- MOTIR Press Centre (English) — The ministry's monthly export-import release in English — item-by-item and destination-by-destination, published on the first working day of each month
- Korea Customs Service trade statistics — The customs database behind the ten-day and twenty-day provisional export figures, searchable by HS code and partner country
- KOSIS — Korean Statistical Information Service — Statistics Korea's English portal, for the industrial production and shipment series that sit underneath the trade numbers
- Bank of Korea ECOS — Balance of payments, terms of trade and export price indices — the place to separate a price effect from a volume effect
- DART electronic disclosure — Samsung Electronics and SK hynix quarterly filings, where the memory pricing driving these export numbers is described in the companies' own words
Frequently asked questions
What share of South Korea's exports are semiconductors in 2026?
Semiconductors were 46.8% of total exports in the 1–10 August 2026 period, according to Korea Customs Service provisional data. For complete months the figure is lower: 41.5% in July 2026 and 38.7% across the first half of 2026, calculated from Ministry of Trade, Industry and Resources releases. The ten-day figure is the highest reading recorded, but it covers a short window and should not be treated as the run rate.
Is Korea's export boom driven by volume or by price?
Substantially by price. MOTIR attributes the semiconductor surge to ‘higher memory contract prices’ alongside AI server demand, and the same release shows petroleum product export values up 34.1% in July while volumes fell 8.8%, and petrochemical values up 10.3% while volumes fell 9.1%. Dollar export totals are therefore partly a price index, not purely a measure of goods shipped.
How much would Korea's exports fall if memory prices reversed?
It depends entirely on how far prices fall, and nobody publishes a forecast worth quoting. The arithmetic is simple, though: chips were $41.01bn of July’s $98.89bn. Halving that line while holding everything else constant gives roughly $78.4bn — still above July 2025’s level, but a fall of about 21% in the headline number. That is a calculation on published figures, not a prediction.
Does the record trade surplus mean the won should strengthen?
Not automatically, and it has not. The January–July 2026 surplus was $168.0 billion, yet the won has stayed weak, because the current account is only one input into the exchange rate — outbound portfolio investment, dividend repatriation and the dollar’s own trajectory all matter. Our earlier piece on the won’s weakness sets out the balance-of-payments mechanics.
Which countries are buying Korea's chips?
In July 2026 exports to China rose 96.2% to $21.68 billion and exports to the United States rose 68.7% to $17.43 billion, both driven principally by semiconductors, with ASEAN at $18.80 billion an all-time monthly record. Chip demand is re-concentrating Korea’s export map on China and the US after two years of gradual diversification.
Where can I check these trade figures myself?
MOTIR publishes an English monthly export-import release in its press centre on the first working day of each month. Korea Customs Service publishes ten-day and twenty-day provisional figures, with the searchable database at tradedata.go.kr. Both are free and neither requires registration for headline series.
Sources & further reading
Every figure in the key takeaways is numbered to the source it was read from. Sources marked primary are the statistics office, central bank, exchange, regulator or filing itself.
- 1July 2026 Exports Reach $98.89 Billion, Second-Highest on Recordprimary — Ministry of Trade, Industry and Resources, August 2026 · verified 2026-08-14
- 2Korea's June Exports Top $100 Billion for First Time, First-Half Exports Reach Record Highprimary — Ministry of Trade, Industry and Resources, July 2026 · verified 2026-08-14
- 3Korea's Annual Exports Reach New Highs in 2025primary — Ministry of Trade, Industry and Resources, January 2026 · verified 2026-08-14
- 4Exports up 45.3% in 1st 10 days of Aug. on chips — The Korea Herald / Yonhap, August 2026, reporting Korea Customs Service provisional data · verified 2026-08-14
- 5Korea's annual exports reach new highs in 2024primary — Ministry of Trade, Industry and Resources via Korea.net, January 2025 · verified 2026-08-14
Read next

Korea will charge 90% after your 300th outpatient visit. Last year that was 7,765 people.
The cabinet cut the excess-use threshold from 366 visits a year to 301 on 8 September. Fewer than eight thousand people crossed the old line — which is the clearest sign the rule is not really aimed at them.
Korea's exports grew 68.7% in August. Strip out three product lines and they grew 2%.
August was Korea's third-biggest export month on record and produced a $34.75bn trade surplus. Almost the entire year-on-year gain came from three lines, and all three are priced rather than produced.
Korea's core inflation hit 3.4%. A phone bill from last August did most of it.
Consumer prices rose 3.1% in August and core inflation rose 3.4%, the sharpest one-month acceleration of the year. Strip out a single expenditure group and the same data show inflation falling.